Restaurant types
Bar, pub and taproom costs: targets and leaks
By Felix S. Pavel · Updated · 7 min read
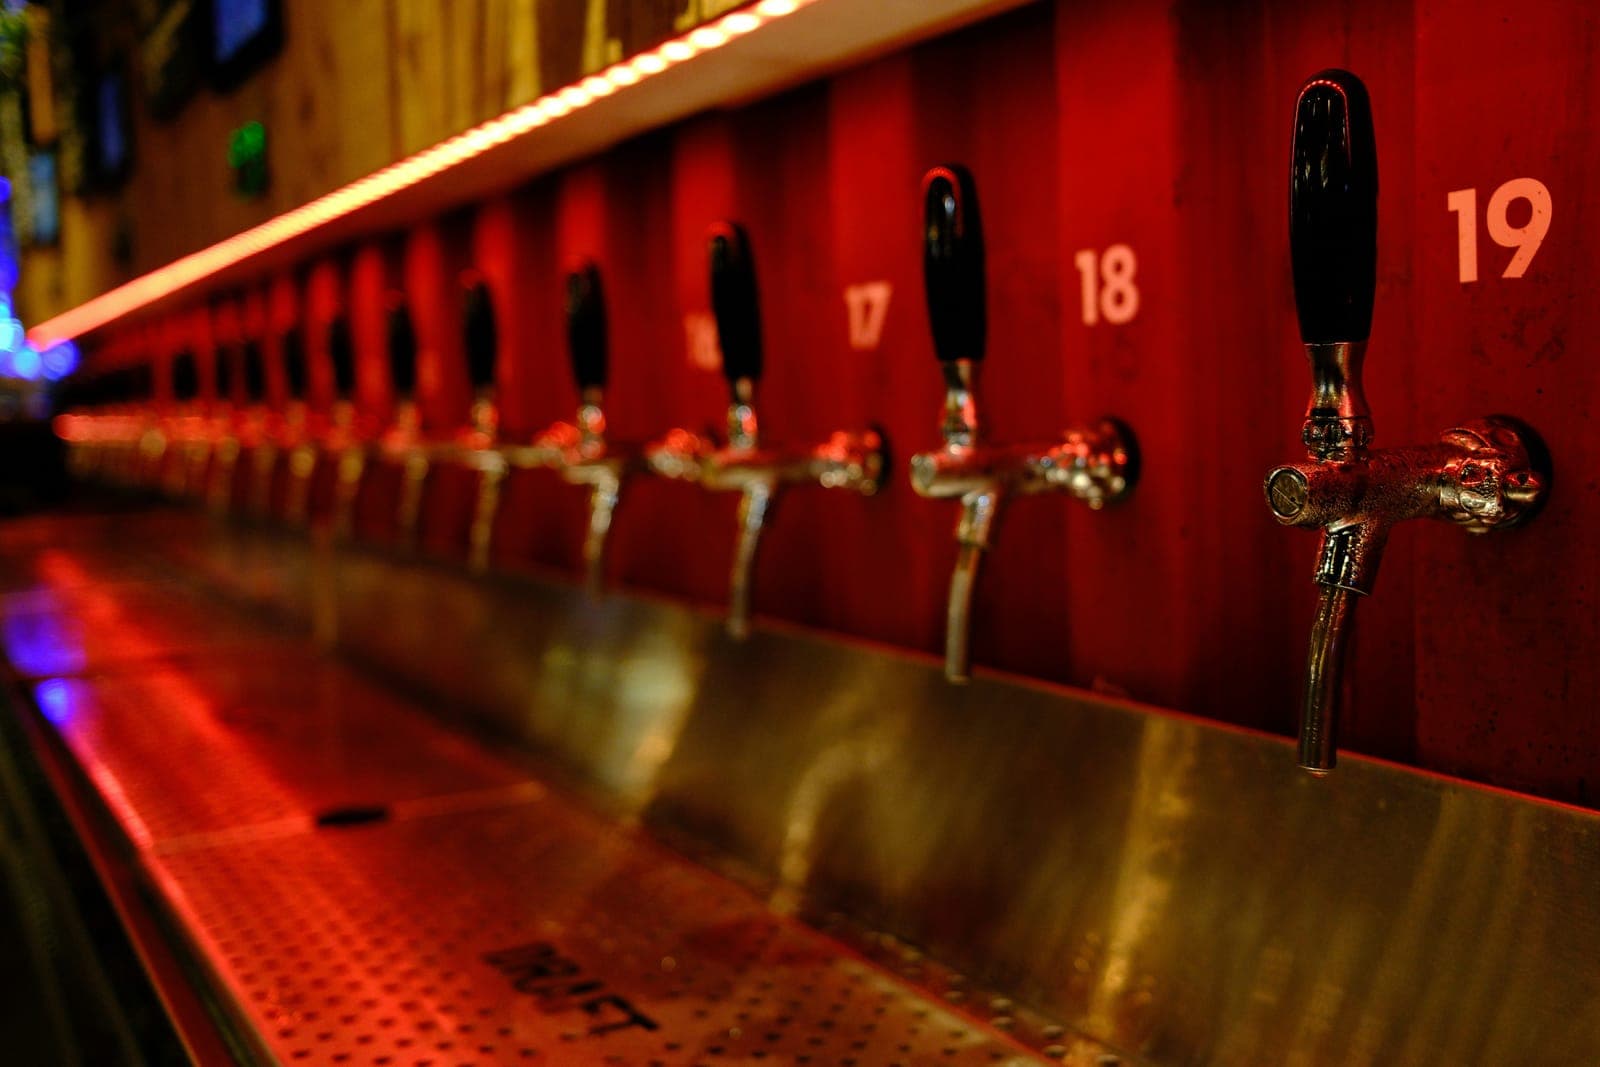
A bar, pub or taproom earns most of its money from drinks. In the free check, that means drinks are about 55% of sales or more, whatever the kitchen serves. With sales that lean on drinks, a bar gets its own targets, lower than a restaurant's. Here are the targets RestaurantDoctorAI uses for bars, why they're our own, and the three leaks the check looks for behind the bar: pours, comps and shrink.
The quick answer
Healthy targets for a bar, pub or taproom: prime cost 57% or less, food and drink 20–26%, labor 25–32%, and rent and utilities 12% or less of sales.
Prime cost % = (food and drink cost + labor cost) ÷ net sales × 100
| Bar, pub or taproom | RestaurantDoctorAI's target |
|---|---|
| Prime cost | 57% or less |
| Food and drink | 20–26% |
| Labor, payroll taxes and benefits in | 25–32% |
| Rent and utilities | 12% or less |
No independent source publishes targets for bars. These are RestaurantDoctorAI's own, the ones the free profit check grades a bar against.
Our targets, and why no median sits beside them
The full-service and quick-service pages put our targets beside the National Restaurant Association's 2024 medians. For bars there is nothing to put there: the NRA publishes no free figures for bars, and we found no government or university source that does. So the second column says what is published, and where.
| Line | RestaurantDoctorAI's target | What's published |
|---|---|---|
| Prime cost | 57% or less | Nothing for bars. RestaurantOwner.com gives 65% for table service and 60% for quick service. |
| Food and drink | 20–26% | Nothing for bars. The NRA's food figures leave alcohol out. |
| Labor | 25–32% | Nothing for bars |
| Rent and utilities | 12% or less | Nothing for bars |
| Drinks' share of sales | About 55% | 21% at full-service restaurants that serve alcohol |
Prime cost: the 57% ceiling is ours. No independent source publishes one for bars. It sits under our 65% full-service line because our food and drink range for bars, 20–26%, sits under full service's, 30–34%: a bar's sales lean on drinks. The labor ranges are close, 25–32% against 30–35%.
The two ranges can't both run at the top. The tops of our bar ranges add to 58%, a point over the ceiling. If labor runs high because the bar is open late, food and drink has to sit lower, and the other way round.
Rent and utilities. We print a ceiling, 12% or less, not a range. Under it is fine, however low. Above it, rent squeezes profit. Liquor liability insurance isn't part of this line or of any of our targets: keep it as its own line, and know what it costs a year before the policy renews.
Why bar numbers online disagree
- Pour cost is not food and drink cost. Pour cost divides what the bar poured by bar sales alone. Our 20–26% target counts the kitchen too, against all sales. A bar with a kitchen reads higher on ours than on its pour cost. Where pour cost fits in your numbers.
- Vendor figures. The pour cost and bar margin figures you'll find online mostly come from point-of-sale and inventory software companies, worked out from their own customers. Our pour cost guide's target comes from one of them, and it says so. No independent survey publishes one.
- The drink mix. Beer, wine and spirits each cost something different per drink. When guests order more of one and less of another, a blended pour cost moves with no leak at all. Work it out by category as well as in total.
- Drinks with or without alcohol. Some figures count only alcohol. Ours count every drink and every plate.
An example month, worked through
This is an example, not an average: one bar with $50,000 in sales a month, $27,500 of it from drinks, food and drink cost at 28% and labor at 30%, inside its 25–32% range.
- Net sales
- $50,000
- Food and drink, 28%
- $14,000
- + Labor, 30%
- $15,000
- = Prime cost, 58%
- $29,000
- Ceiling at 57% of sales
- $28,500
That's $6,000 a year, and all of it is food and drink: 2 points over the 26% top of its range. Each point of sales here is $500 a month. Behind the bar is the first place to look: for a bar this size that free-pours, the free check's own estimate is $605 to $1,210 a month.
Where bars lose money
The free check asks one question about the bar: “How do you control drink pours?” The first three leaks below are what it looks for. The dollar figures are its own estimates for the $50,000 example bar, before it caps the total of all leaks.
Pours nobody measures
A free pour runs a little long, and on more than half of a bar's sales a little adds up. If your answer is “Free pours, no pour-cost checks”, the check counts $605 to $1,210 a month at these sales. The fix: every spirit pour through a jigger, and the standard pour for each drink written on a card behind the bar. How to work out and fix pour cost.
Comps nobody writes down
A round for a regular, a remade drink, a staff drink after close. Each is fine on its own. Unrecorded, they look exactly like theft or over-pouring in the count. The fix: ring every free drink into the POS as a comp, or log it on a sheet with a manager's initials, so the count can tell them apart. Why pour cost drifts upward.
Shrink found only when a bottle runs dry
If your answer is “Spot checks when bottles run out early”, the missing product is found only once it's gone. The check counts $303 to $605 a month at these sales. The fix: count the bar every week, on the same day, by the same person. Compare your top 20 bottles used with what the POS says was sold, and kegs used with pints rung in. Fixing a high pour cost.
A full crew on a quiet night
Bars run late, and a Tuesday at 11 p.m. costs the same per hour as a Saturday. If everyone works their scheduled shift anyway, the check counts $400 to $850 a month at these sales. The fix: set a cut line, the sales per labor hour below which the first person goes home, and check it on the hour. How to set your cut line.
Prices raised to cover a leak
Drink prices at bars and restaurants rose 2.6% in the year to September 2026, while alcohol in stores rose 0.2% (Bureau of Labor Statistics: away from home, at home). Store prices aren't what a bar pays its distributor, but guests see both. The fix: close the pour and comp gaps before you raise a price.
Fewer guests who drink
54% of US adults said they drink alcohol in 2025, down from 62% in 2023 (Gallup). The fix: cost your alcohol-free drinks and your food the way you cost a cocktail, so the guest who doesn't drink still earns the seat. Plate cost calculator.
Bartender pay, tips included
The median bartender earned $16.51 an hour in May 2025, and $16.01 in drinking places, against $17.07 in full-service restaurants. These figures include tips (Bureau of Labor Statistics). What you pay before tips depends on your state's tipped wage rules, and our labor target counts what you pay, payroll taxes and benefits in, never the tips guests leave.
Taprooms and brewpubs
The Brewers Association calls a brewery that sells 25% or more of its beer on site a taproom brewery when it runs no significant food service, and a brewpub when it does (its definitions). In the free check, go by sales, not the license:
- A taproom where beer and other drinks are about half of sales or more: bar, taproom or lounge.
- A brewpub whose kitchen sells more than its taps, with servers at the tables: full service.
- Either way, compare kegs used with pints rung in each week. A keg that pours fewer pints than it should is shrink.
Questions bar owners ask
What is a good prime cost for a bar?
RestaurantDoctorAI uses 57% or less. It's our own line: no independent source publishes one for bars. Prime cost under it leaves room for rent, insurance and profit.
What pour cost should a bar aim for?
The pour cost guide gives the target we use and where it comes from, with the formula for a week and for one drink. Bar pour cost: how to calculate and fix it.
Is a pub with a kitchen a bar or a restaurant?
Go by sales. If drinks bring in about half or more, pick bar, taproom or lounge in the free check. If food brings in more and servers take orders at the table, pick full service.
Is a 30% labor cost high for a bar?
No, it's inside our 25–32% range. Check it with food and drink: at 30% labor, food and drink has to stay at 27% or under to keep prime cost at 57% or less.
Check your own numbers
Free calculators for the numbers on this page. No sign-up.
Free calculatorLabor cost calculatorLabor as a share of sales, payroll taxes and benefits in, against the 25–32% range, plus your cut line.Free calculatorBreak-even calculatorThe sales a month needs to pay every bill, insurance included.Want every leak with its dollar estimate and a plan? See what the full report adds.
RestaurantDoctorAI's targets are its own; every outside figure is linked where it's quoted. General information, not financial, tax or legal advice.